JS++ 0.4.2.2 is being released today with support for in-browser debugging via source maps. Source maps allow you to debug your JS++ programs from a web browser of your choice that supports source maps debugging: Google Chrome, Mozilla Firefox, Microsoft Edge (untested), etc. With source maps, you can set breakpoints, log messages, and more with all locations pointing back to the original source JS++ file—rather than the generated .jspp.js file.
At the time of this writing, the recommended web browser to use for source maps debugging is Google Chrome.
In order to leverage source maps, compile your JS++ files with the --debug (or -d) flag:

This will generate a .map file, which maps the generated code back to the original JS++ source code.
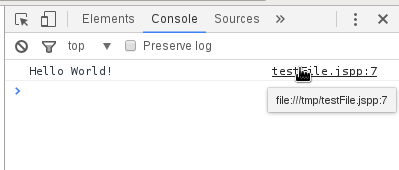
When you run the generated code in your web browser, you will notice that console.log statements point to the original source .jspp file’s location rather than the locations of the generated code:

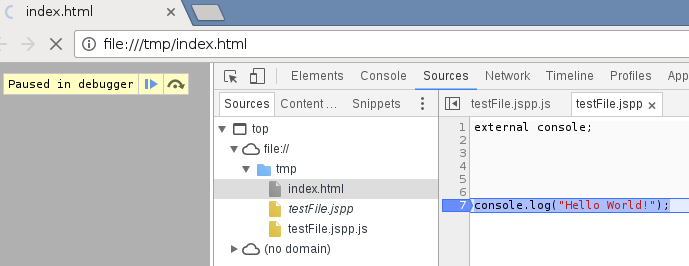
In addition, you can set breakpoints, step into, step over, step out and use all the features you’d expect from your debugger:

Finally, we have worked to improve Microsoft Windows integration even more. In JS++ 0.4.2, we gave you Windows context menu integration. However, due to restrictions in Windows, this only allowed compilation of one file. JS++ is a multi-file, modular programming language. Thus, we needed users to be able to select multiple files and compile them. You can now do this in the latest version of JS++:

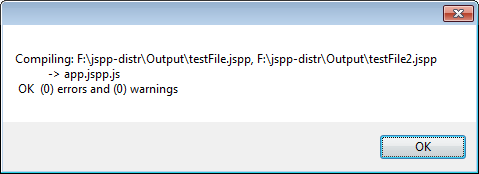
Another problem with Windows integration was that the JS++ CLI compiler would pop up and immediately exit. If you had an error, there was no way to know what to fix. With the latest version of JS++, you will now receive a popup dialog notifying you of the compilation results:

Get the latest download of JS++ by navigating to our home page.
